Get your metrics on: How to measure DevOps success
Recently, I was working with a product team who were eager to find out how they could measure their DevOps success.
It started with this really simple question:
How do we know if we are getting better?
Ask this same question to a doctor, or a pension fund manager, or a farmer.
They’ll probably all tell you that they take measurements. Then they use them to see if they are improving or not.
But how do you take measurements for something like “DevOps”? It’s quite an intangible thing, isn’t it?
Where do you even start? What metrics should you gather, to display on your DevOps dashboard?
In this article, I’ll look at some of the key measurements that you can start observing, so you can begin to measure the success of your DevOps initiatives.
How to not waste your time
Before we start, here’s a nice thing to think about:
There’s no point wasting time gathering unnecessary metrics.
Although it might seem cool to have a dashboard that looks like it came from the Starship Enterprise, it will take you a long time to get there. And you might not even need it.
You don’t need to capture everything. You can get pretty far by starting with basic tools, and a small number of metrics.
Always focus on the metrics that will give you the most insights for the lowest investment.
In other words, focus on getting the biggest bang for your buck.
Most teams should be spending more time on delivering a useful product, than gathering metrics.
Which DevOps metrics should you capture?
So now we’ve established what metrics are, and how to make the best use of your time, how do you know which are the most valuable metrics to capture? Is there a set of recommended metrics that you should observe?
I would start with the “big four”.
Measure the Process: The Four DevOps Metrics
In the book Accelerate: Building and Scaling High Performing Technology Organizations (read now on O’Reilly), Nicole Forsgren, Jez Humble and Gene Kim suggest that there are four key measures which capture overall delivery performance:
-
Lead time, specifically delivery lead time
-
Deployment frequency, or deployment rate
-
Change failure rate, and
-
Mean time to restore
Let’s look at each of these in turn, see what they are, and how you can measure them.
1. Lead time
Lead time is a measurement of how quickly work can be completed.
It measures the time taken from a request from a customer (like a request for a new feature in the product) to the request being completed, or implemented.
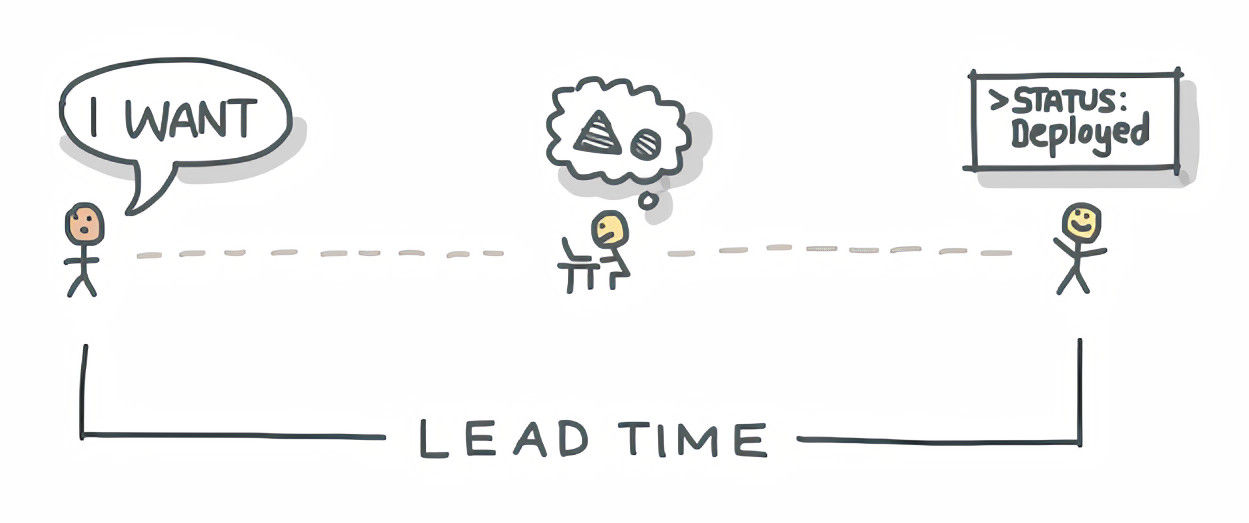
For example: a user asks for a search feature to be added to your product. The lead time would be the time it takes to write the code for the search feature, and release it to the user.
This is where a project management tool like JIRA might come in useful. It can track the time taken between a feature being added, and a feature being completed.
Or, a simple alternative is to track all feature requests in a spreadsheet, along with the dates they were requested, and then later completed. Now you have your lead time.
2. Deployment frequency
Deployment frequency, or deployment rate, measures how often you release changes to your product.
It’s usually correlated with the effort required to do a deployment.
If a deployment requires little effort (a small batch size), then you will find it easier to deploy frequently.
If a deployment is a lot of work (a high “batch size”), then you probably won’t deploy as often.
Deploy frequency is highly correlated with continuous delivery and the comprehensive use of version control.
Why these metrics matter
Lead time and deployment frequency are both important. Together, they hugely affect how quickly you can get new features out to users.
Let’s say you run a shopping site, and your biggest competitor, Spamazon, has just launched an amazing new feature.
You want to implement your own version of the feature, because people are leaving your shop in droves to shop with Spamazon.
If you have a small lead time, and high deployment frequency, you might be able to get the feature developed and implemented pretty quickly.
But if your lead times are long, and deployment frequency is low, it will take longer to get the feature into production. This could mean potentially thousands or millions of pounds in sales lost to the competitor.
3. Change failure rate
This measures the percentage of changes that cause some kind of failure.
In this context, a change is not just a change to the product, but also any change to its environment. Perhaps a change to the server, or the cloud settings. Anything which might affect the product.
4. Time to restore
When something does go wrong, how quickly can it be fixed?
You’ll be acutely aware of this metric if you work in operations.
Server went down? How long does it take to restore from a backup?
A change introduced a critical bug? How long does it take you to roll back to the previous good version?
These four metrics are primarily ways to capture the throughput of your team and stability of the product.
You can also find these metrics discussed in another report authored by Nicole Forsgren and co, called the State of DevOps report. And the authors also looked at the subject in an article for ACM’s Queue magazine (PDF).
How to use these metrics
If your lead time is short, then it’s telling you that you are able to get new features into production very fast. High deployment frequency can also help with this, because you are able and confident to deploy regularly, sometimes multiple times in the same day.
With change failure rate, this metric calculates the percentage of changes to your software (like new features or bug fixes) that lead to a downgrade in service, such as an outage or error. Combined with the time to restore metric, this gives you a pretty good idea of how resilient your software is, and the processes around resolving issues when they come up.
So these four metrics capture the “dev” and “ops” of your DevOps processes.
The important thing to remember when capturing metrics is that they are most useful when they are observed in trends. So don’t be fixated on getting change failure rate to an absolute minimum, for example.
Focus on creating an environment where that metric improves over time. You will stay motivated, if you can see that you’re moving the needle in the right direction.
Displaying metrics on a dashboard
Once you’ve started gathering your DevOps metrics, how should you display them?
It’s all about radiating this information, and doing it early. I think it’s much better to show your metrics, even if you’re still at the early stages and you’ve got little to show.
I personally love to look at dashboards as it really gives a birds-eye view of how things are going.
Some teams re-purpose an old monitor lying around the office, and hook it up to their laptop to show dashboards. Or, if you’ve got budget, splash out on a nice new display.
You don’t need a high-spec computer either. You can even show your dashboard using a simple computer like a Raspberry Pi.
The important thing with displaying metrics is this:
If your metrics are buried away deep in a spreadsheet somewhere, you won’t bother looking at them. So make the effort to surface this information visually, and encourage everyone to look at it.
The best way to do this is to use a dashboard tool. So in the next section we’ll look at some DevOps dashboards you can use.
DevOps dashboard tools
If you want to set up your own DevOps dashboard, the options are vast! So I did some research to find some of the different dashboards that people are using to display metrics today.
Here are five tools you can use to can gather and report your DevOps metrics, from pipeline to production.
1. For build status and stats: Jenkins
Controversial opinion: Jenkins can produce some very useful DevOps stats, without much effort.
Some of the metrics you can capture easily with Jenkins are:
-
Build time: from start to finish, Jenkins, monitors how long your builds are taking and displays these in the Job View.
-
Test results: Jenkins can display the total number of tests, and number of tests failed. You can use the
junitstep in your pipeline to do this. -
Build/deployment frequency: this important metric can be derived by looking at the number of jobs you run per day.
These metrics will help you figure out your deployment frequency.
For many teams, metrics from Jenkins might actually be sufficient. If you’re striving to always be improving your build process, then you should be building and deploying as often as possible (that’s the “CD” in “CI/CD”).
2. For lead time: Jira
Do you use Jira as an issue tracker? You probably do. Hundreds of thousands of companies use Jira.
You probably didn’t know that it has the ability to display dashboards from your data.
A lot of people find working with Jira a bit of a pain. But if it is used properly, it’s an awesome tool for capturing all sorts of data about your product pipeline.
Let’s say you want to figure out your lead time. If a feature request has been added as an issue in Jira, then you can capture the date that the feature was added, and follow the progress of that feature through development, testing, and eventually into production.
This means that you can capture the total lead time for a feature to go from inception to production.
This is very powerful!
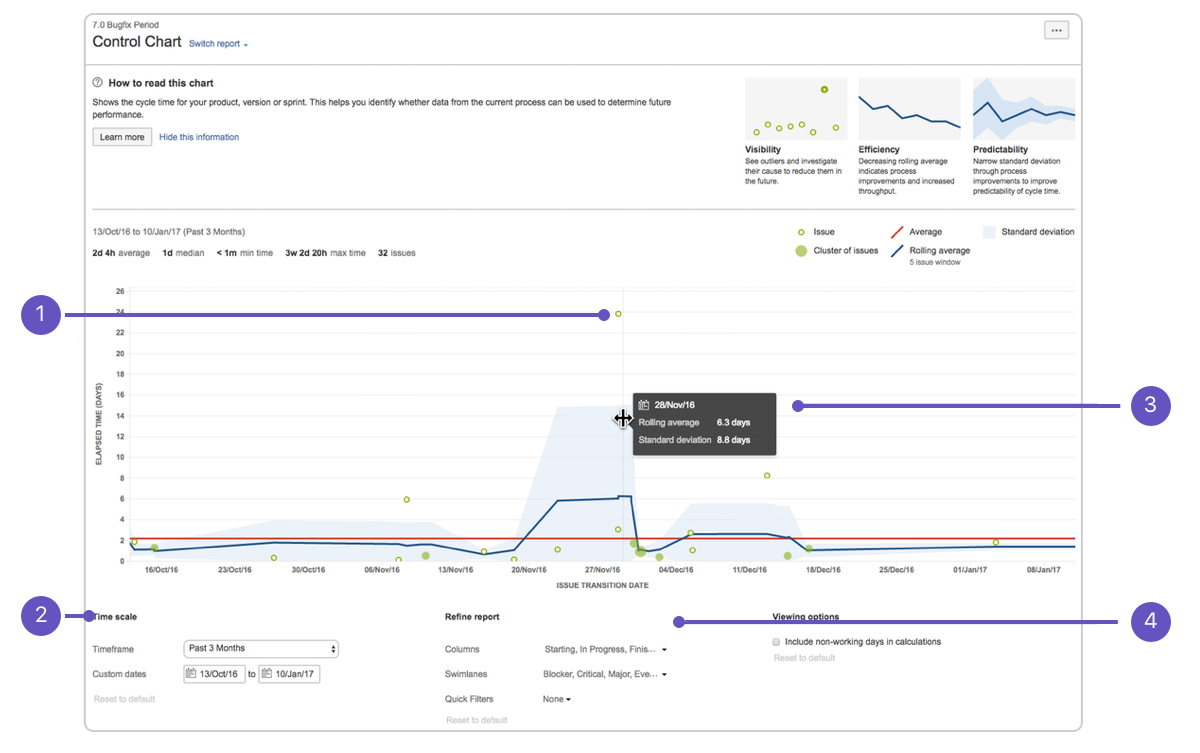
Use the Control Chart in Jira to display the Lead Time for your project
Source: Atlassian
If you use metadata to your issues in Jira, then you could also drill down to figure out the lead time for critical bug fixes, compared to non-essential enhancements.
Of course, this depends on using Jira correctly. This is difficult. If your team has a lot of reluctance to use Jira fully, then your metrics won’t be as useful.
But, as with everything: start with the basics, and improve from there.
If you start by tracking your tasks in Jira, and being honest about when the task was created, and when it was completed, then you could be well on your way to tracking a measure which can become your lead time metric.
3. For overall DevOps health: Hygieia Dashboard
Hygieia is a super useful piece of software and I really like it. Hygieia is designed, from the ground up, as a DevOps metrics dashboard. It is designed specifically to do that, and nothing else.
Hygieia is an open source web app and database which you can deploy in your own environment. It can be used as an information radiator to display the overall health of your DevOps pipeline.
It works by harnessing a collection of “agents”, which capture metrics from your applications like Jenkins and Jira, and feed them into its database, for displaying on the dashboard.
Hygieia puts the most important DevOps metrics front and center. This is because it’s written by the DevOps team at Capital One bank, so they already know the most useful metrics to display. This includes things like:
-
Build status
-
Code quality, from a static code analysis tool like Sonarqube
-
Code repository metrics
-
Feature and issue tracking, from Jira and others
You can choose from three standard dashboards – Team, Product, and Executive – each of which shows the most relevant metrics to the intended audience.
Internally, Hygieia stores metrics in a MongoDB database, and surfaces them using a very nice web UI.
Deploy Hygieia into your environment, grab that spare monitor you’ve got kicking around the office, and set up Hygieia to display your DevOps metrics.
4. For production operations: Datadog
If you’ve got a budget to spend, you cannot beat Datadog.
Datadog is a dashboard and metrics collector, which gives you a very nice visual view of your DevOps metrics in real time.
It comes with over 400 connectors, to cover all of your production components. The connectors cover everything from Java applications, to Jenkins instances, AWS services, Apache Kafka clusters, and more.
Datadog is geared towards tracking application performance and stability. So you can use it to detect issues, and make production troubleshooting easier.
However there are plug-ins for GitHub, BitBucket and other source code tools. This means that you can produce dashboards of your production metrics, alongside events from your source code repositories.
Datadog is a SaaS product, and available by subscription. It can be expensive for monitoring a lot of hosts, but it is also very easy to use and comprehensive.
5. For the DIY approach: Grafana
If your budget doesn’t stretch to Datadog, or you just want to create your own monitoring and metrics solution, then you can try Grafana.
Grafana is a generic, highly customisable dashboard tool, which can be plugged into lots of different data sources.
Think about it as a blank canvas, or a visualiser for data.
This means that the sky is the limit. You can mix development metrics on the same view as stats from your production servers.
But you need to supply the data to Grafana, by placing it into a time-series database which it can report from.
A time-series database is a piece of software which stores data with the time it occurred. It allows you to record data, and see trends of how the data has changed over time. With Grafana, many people use InfluxDB or Prometheus as the time-series database.
First, you’ll need to get the metrics into your time-series database, using a collector. A collector takes metrics from the applications or hosts you are interested in, and feeds them into the database.
You can use an existing collector, like a tool that already ships with your app framework that sends metrics to Prometheus. Or you can write your own custom collector.
Then, you will have data to report on. You can now create a dashboard in Grafana to display these metrics, in a way that suits you.
Summary
So, to summarise, some of the best practices when gathering and displaying your DevOps metrics are:
-
Start collecting metrics now, and establish a baseline that will allow you to track future changes
-
Focus on gathering meaningful and valuable metrics
-
Look at trends, rather than absolute numbers
-
Use the Four Key Metrics to start with. These can help you measure your DevOps processes.
-
Focus on improving your deployment frequency – this helps to improve your Change Failure Rate, and Lead Time.
-
To improve your Deployment Frequency, increase your confidence in changes, using things like automated tests.
-
Use data that you already have, for example in Jira or Jenkins
-
Consider using a dedicated DevOps dashboard, like Hygieia
-
If you have the budget, consider using a SaaS dashboard app, like Datadog
-
For a “roll-your-own” approach, look at Grafana, plugged into a time-series database and collectors
Happy metrics gathering!