How to Make Sense of Linux System Stats in Top
This is my complete guide to understanding the plethora of CPU, memory and load stats that you can get from your Linux server, using the top command.
If you want to figure out how overworked (or underworked!) your Linux server is, then dive right into this.
top is the first tool I turn to, when I need to investigate a performance issue in Linux. It’s like a Linux command-line equivalent of Windows Task Manager. So, let’s take a look, shall we?
What is ‘top’?
The top program is one of the main system and process monitoring commands on Linux. If you want to get a rough idea of the CPU and memory usage of your system, or see a list of the top processes and programs currently running, run top.
top actually stands for…. Table Of Processes. (So now you know!)
To start top, just type top in a terminal.
top is fairly ubuqitous, so you should find it on most Linux systems. But, if you need to install it yourself for some reason, you can find it in the package procps-ng (on Fedora and RHEL).
Sample output from ‘top’
When you run top, you should see output that looks something like this:
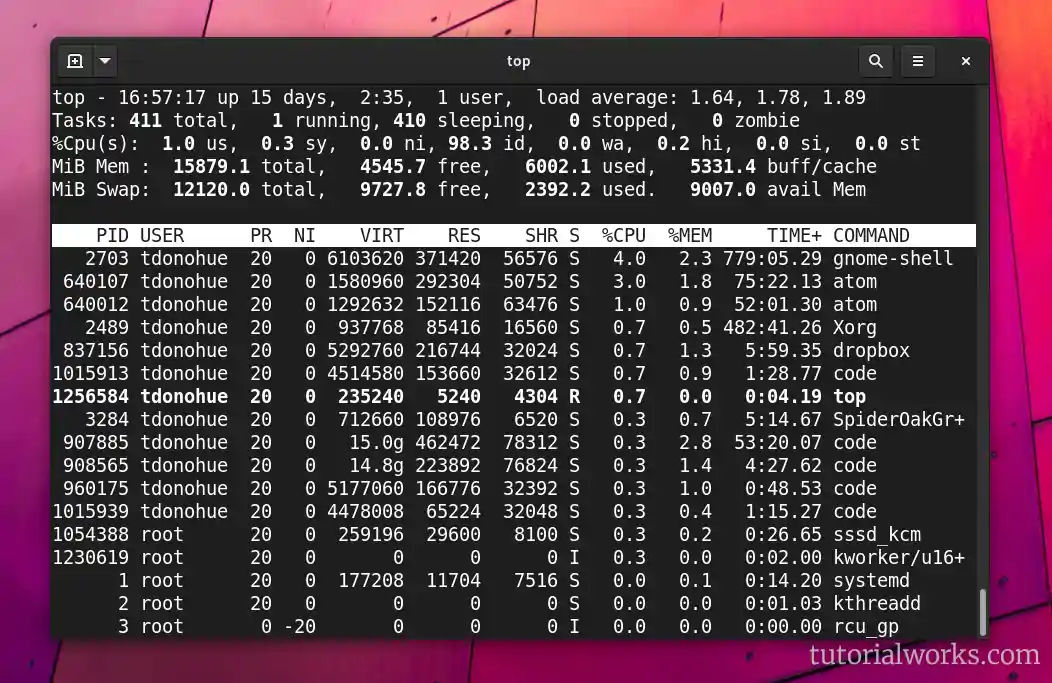
The toppermost of the poppermost: output from the top command
Top command
by
Tutorial Works
is licensed under
CC BY-SA 4.0![]()
![]()
![]()
The first section of the screen shows your server stats: server load, CPU, memory usage and your number of tasks or processes.
The second section shows the table of processes (hence the name top!)
In this article, we’ll focus on the overall system health stats in the top section. There are a lot of numbers here. What do they all mean? Let’s dive and try to decipher each set of numbers:
-
Load average
-
CPU
-
Tasks
-
Memory and swap
📈 Load average
The load average is the figure at the top right of top. It’s a measure of how busy the system is. It is taken by looking at tasks that are running on the CPU, and those that are waiting to run. You get a set of 3 figures, which show the average system load, over the last 1 minute, 5 minutes and 15 minutes:
load average: 1.64, 1.78, 1.89
A real example
The graph below shows the 1, 5 and 15 minute load averages on my (4-CPU) Linux desktop, when I run a load test. I run a process which demands a lot of CPU power, which causes a spike in the 1-minute load average. Then, I stop the process after a few minutes, but I continue to gather metrics. Here are the results:
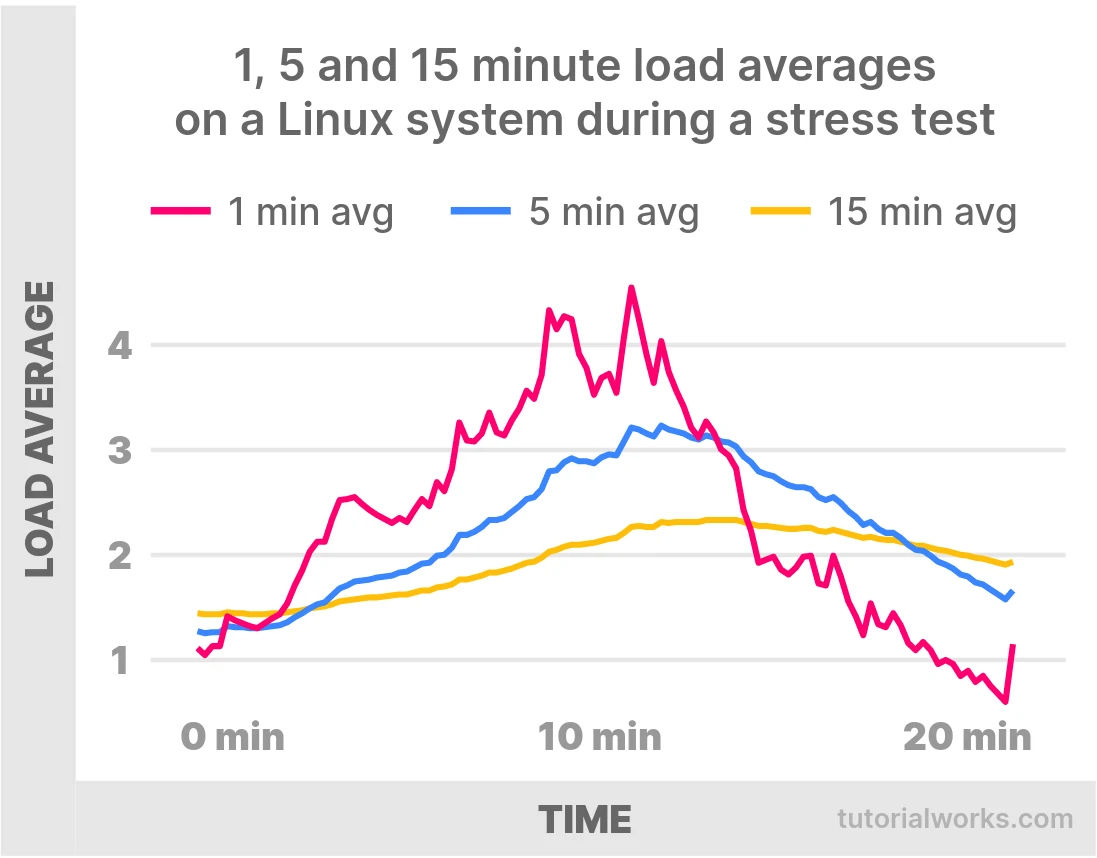
How 1, 5 and 15 minute load averages relate to each other
Load average in Linux graph
by
Tutorial Works
is licensed under
CC BY-SA 4.0![]()
![]()
![]()
As you can see, all 3 averages increase very slowly. The 1-minute load average takes almost 10 minutes to reach 4.0. The 5 and 15 minute load averages increase even more slowly still. So when looking at load average, bear in mind that the figures are a little moderated by time.
How was this graph produced?
This little graph was produced by extracting the load average data over ~15 minutes, using this command: awk -v date="$(date +"%T")" '{print date","$1","$2","$3;}' /proc/loadavg. Then, the results were put it into LibreOffice Calc, to produce a chart. See the data on GitHub Gist
Got multiple CPUs?
Load average takes your multiple CPUs into account. So if you have multiple cores (as most modern computers do), you can divide the load average by the number of CPUs, to get the system load as a whole.
For example, if you have a quad-core machine (4 cores), then 100% utilisation for you would mean a load average of 4.00. Ray Walker calls this “perfect utilisation”:
The point of perfect utilization, meaning that the CPUs are always busy and, yet, no process ever waits for one, is the average matching the number of CPUs.
To find out the number of processing units available on your system, you can use the handy command nproc!
System load helps identify trends and their duration
Load average gives you a good idea of whether your Linux server is becoming more or less busy, and how long it has been that way. 📈
The load average might seem high on one system, yet it might still feel zippy and responsive. So while load average might not give an exact measure of “busyness”, it will definitely help identify whether your system is getting busier or not.
For example, if the first figure (the 1-minute figure) is higher than the 2nd and 3rd figure, then your system load is increasing, which means your server is getting busier. But, if the first figure is lower than the 2nd and 3rd figures, then your system load is decreasing.
📌 Tasks
The next line down in top shows the number of tasks, or processes in the system. (top calls them tasks here.)
Tasks: 397 total, 1 running, 395 sleeping, 1 stopped, 0 zombie
Processes in Linux can move between different states, as you can see in this graphic:
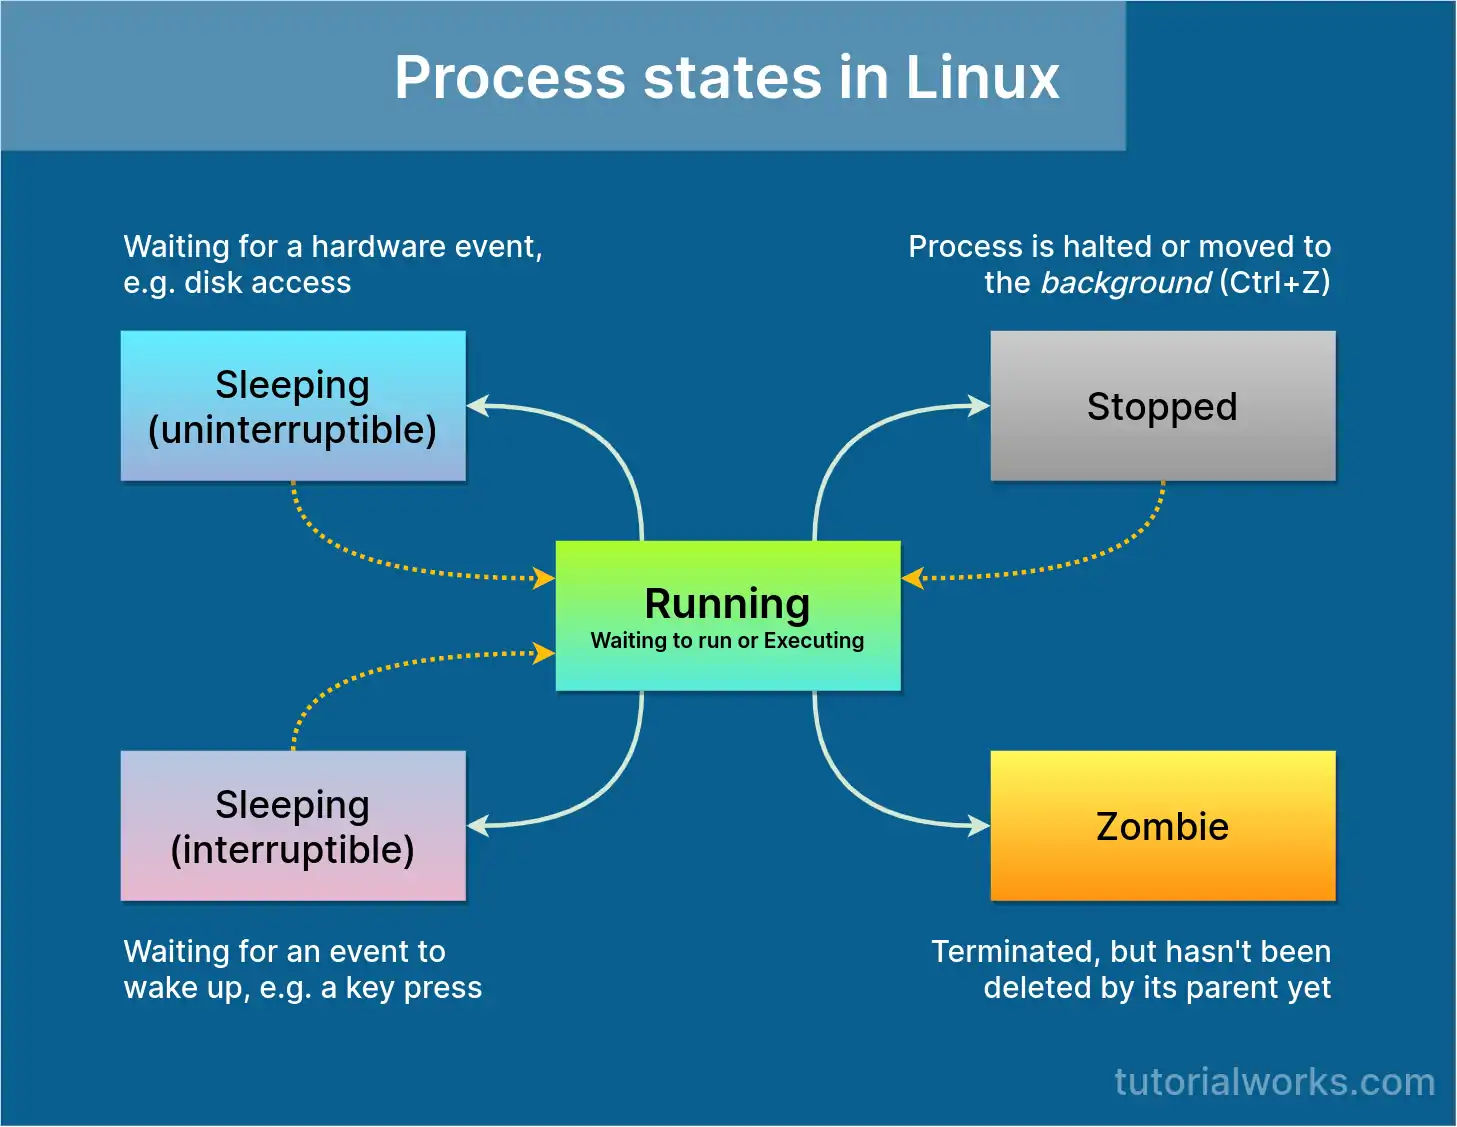
Sleeping, running, stopped and zombie processes in Linux
Linux process state diagram
by
Tutorial Works
is licensed under
CC BY-SA 4.0![]()
![]()
![]()
-
Total - This is the total number of tasks (no further explanation needed!)
-
Running - These are tasks which are either currently executing, or are queued up, waiting to run.
-
Sleeping - Tasks sleep when they are waiting for something; often a task needs to wait for a resource like a disk, or network I/O. Most processes running on your system will be in the sleep state for most of the time, then they wake again whenever the resource they were waiting for becomes available. (So lots of sleeping tasks is quite normal.)
-
Stopped - These are tasks which are paused in a way. You can affect this number by starting a foreground process (e.g.
python) and then pressing Ctrl + Z. This will suspend the python process, and you should see that the count of ‘Stopped’ processes will increase by 1. -
Zombie - In Linux, every process has a parent. If a process exits, but its parent doesn’t clear things up properly, the process appears as a zombie. Zombie processes are already dead (hence the name!)
top displays tasks by default. But if you want to see threads instead, you can switch to that by pressing Shift + H. A single process can contain multiple threads, so the counts for threads will be higher.
🧠 CPU usage
The CPU stats in top give you information about what your CPU(s) are up to. It shows you the percentage of time that the computer’s CPUs spent on performing different types of tasks. This data is basically real-time, so the numbers you see are based on the interval since the last screen refresh.
The CPU usage line looks like this:
%Cpu(s): 6.8 us, 3.3 sy, 0.0 ni, 88.5 id, 0.0 wa, 0.9 hi, 0.5 si, 0.0 st
This is… somewhat abbreviated. So let’s see what each of these abbreviations mean:
| Measure | What the docs say | Example |
|---|---|---|
| us (user) | Time running “un-niced” user processes | Regular user process/code |
| sy (system) | Time running kernel processes | Accessing system resources, I/O, process management. |
| ni (nice) | Time running niced user processes | Regular user process that has been prioritised with nice |
| id (idle) | Time spent in the kernel idle handler | When the CPU is idle |
| wa (IO-wait) | Time waiting for I/O completion | Waiting for a disk read/write to complete |
| hi | Time spent servicing hardware interrupts | When a network card receives some data |
| si | Time spent servicing software interrupts | An exception or event raised by a program |
| st | Time stolen from this vm by the hypervisor | When the CPU is waiting for this VM’s hypervisor to attend to another VM |
You can press t to show a different CPU stats view, which shows the combined percentage of nice and un-niced user processes; the system percentage; the total usage; and a small text-based gauge.
🐘 Memory
In top, memory is displayed in “MiB” or mebibytes. 1 mebibyte equals 1,048,576 bytes, which is 1024 x 1024 bytes.
MiB Mem - This shows you….:
-
Total - your total installed memory
-
Free - This shows memory which is totally unused. On a typical Linux system, this will be quite low, because the kernel uses free memory to cache files (see the “buff/cache” definition)
-
Used - Memory which is being used
-
Buff/cache - Linux borrows memory from your free pile, and uses it for storage I/O buffers (“buff”) and to cache files (“cache”). But, it will return this memory to free state if there is demand for it (for example, if you start an application that needs to consume memory).
MiB Swap - This shows you….:
-
Total
-
Free
-
Used
-
Avail Mem
How to run a load test with stress-ng
You’ve learned about the basics, so how about seeing how your system reacts under load?
To understand the stats in top further, you can run a test program which consumes a lot of CPU or memory. The stress-ng package will help you do it.
stress-ng can help you to stress-test a Linux system in various ways. You can get it using your package manager, so you can install it with apt-get or yum/dnf, depending on your system.
Once you’ve installed stress-ng, you can create a process which starts a worker that continuously writes to 500 Megabytes of memory:
stress-ng --vm-bytes 500000000 --vm-keep --vm 1
top will help you see memory and CPU utilisation, which gives you an idea of how your workloads are doing. However, if you’ve got performance issues, you might need to investigate further.
But it doesn’t easily tell you whether your CPU is saturated, which is when your memory and CPU are at capacity, and there are still other tasks waiting to be done.
Further reading
If you want to know more about memory and CPU usage in Linux, then check out these great articles around the web:
-
Linux Memory Management FAQ (archive of gentoo-wiki.com) - This FAQ, archived by archive.org (the original domain name is now sadly occupied by some spammy nonsense), answers some common questions about how Linux manages memory.
-
USE Method Linux Performance Checklist - this cheatsheet of Linux commands gives you all sorts of metrics about utilisation and saturation, which can help you to diagnose bottlenecks and other performance niggles.
-
Linux Ate My Ram - a funny reminder to not be worried when you see your “free” memory looking low in Linux
-
man 7 pthreads