Managing your Podman containers with Cockpit on Fedora
Generally I work a lot in a terminal and manage my containers with podman commands.
But if you prefer to manage your containers from a UI, then I’ve got a tip for you! (No judgement here… I sometimes need a break from typing too.)
Cockpit is a nice UI for managing your Fedora system as a whole, and it also has a feature for monitoring Podman containers.
So let’s take a dive into Cockpit and Podman.
You can do a lot with Cockpit
Cockpit is an all-in-one web-based administration tool for Linux. Think about it like a web-based view onto your computer or server, or perhaps as a way of monitoring a server in your homelab.
It has a lot of features out of the box, and can be extended with extra components.
When you add the cockpit-podman component, Cockpit can give you a view onto your Podman containers from a web browser, that looks like this:
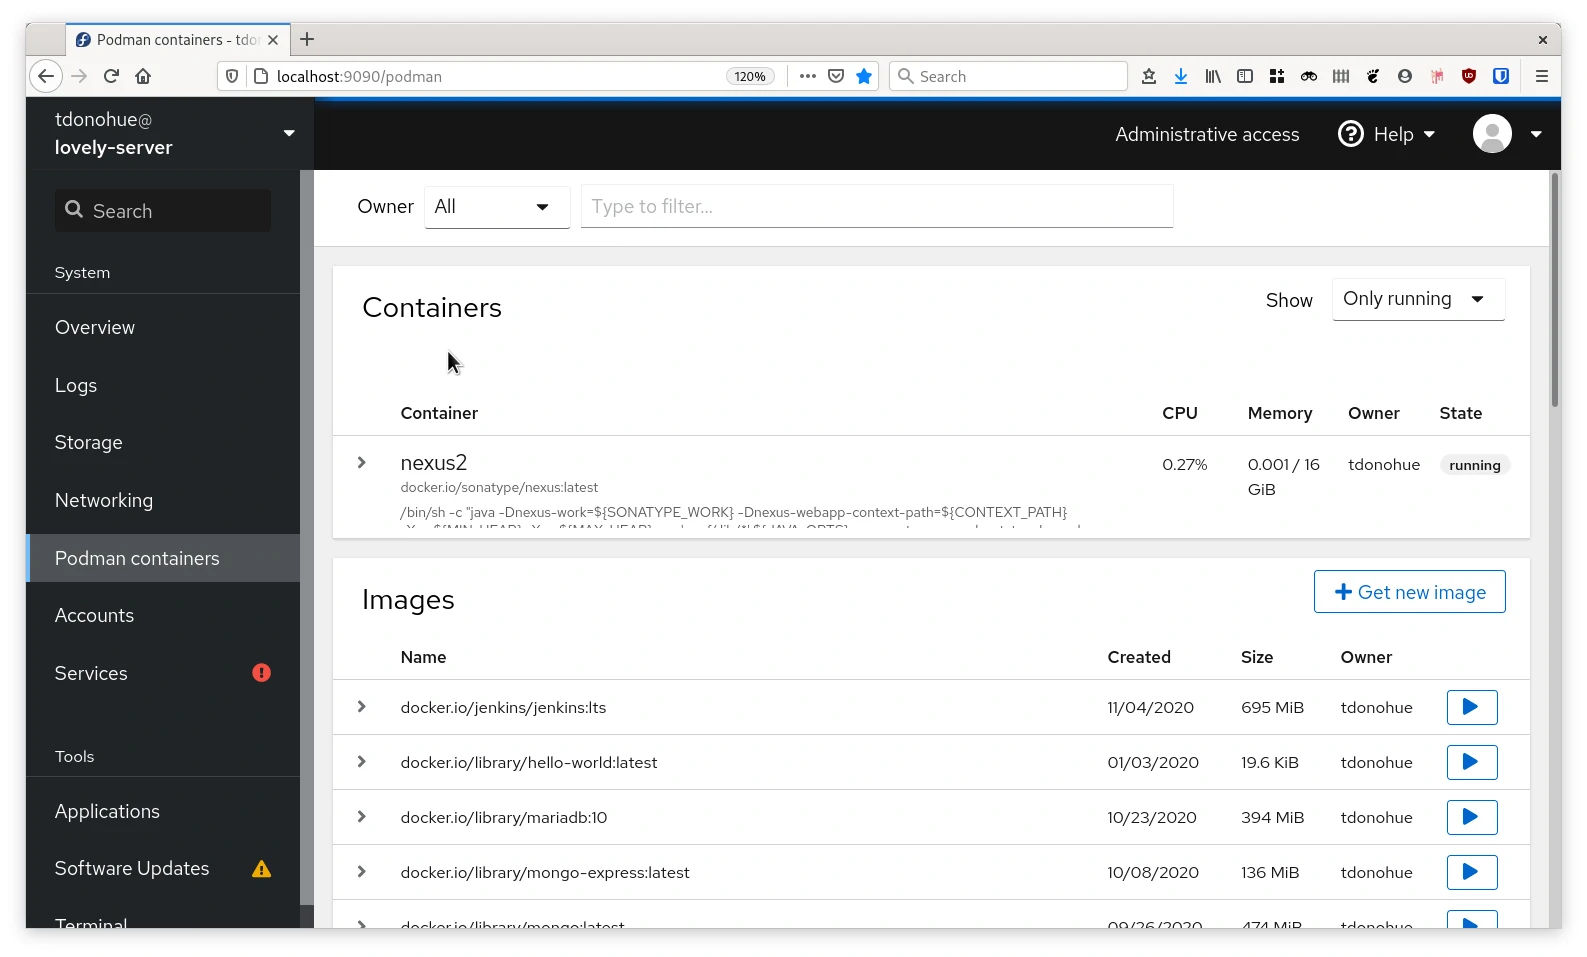
You can use the Podman containers view to see all your containers and images
With Cockpit, you can:
-
See the containers you are currently running and manage them
-
Launch new containers
-
Search for images in registries
-
List your images
OK, let’s get going. First we’ll install the relevant packages.
Install and start Cockpit
If you’re not already running Fedora Server (which comes with Cockpit pre-installed) then you’ll need to install Cockpit using dnf.
So let’s install it now using dnf install:
sudo dnf install cockpit
The output should look something like this:
Installed:
  NetworkManager-team-1:1.26.4-1.fc33.x86_64              clevis-15-2.fc33.x86_64
  clevis-luks-15-2.fc33.x86_64                            clevis-pin-tpm2-0.2.0-1.fc33.x86_64
  cockpit-234-1.fc33.x86_64                               cockpit-bridge-234-1.fc33.x86_64
  cockpit-networkmanager-234-1.fc33.noarch                cockpit-packagekit-234-1.fc33.noarch
  cockpit-storaged-234-1.fc33.noarch                      cockpit-system-234-1.fc33.noarch
  cockpit-ws-234-1.fc33.x86_64                            jose-10-8.fc33.x86_64
  libjose-10-8.fc33.x86_64                                libluksmeta-9-8.fc33.x86_64
  luksmeta-9-8.fc33.x86_64                                reportd-0.7.4-8.fc33.x86_64
  sscg-2.6.2-2.fc33.x86_64                                udisks2-lvm2-2.9.1-2.fc33.x86_64

Complete!
We also want to install the “Cockpit component for podman containers”, cockpit-podman:
sudo dnf install cockpit-podman
Then, enable the cockpit socket. This ensures that Cockpit will start every time you boot your system:
sudo systemctl enable --now cockpit.socket
To check that cockpit is running, you can use the systemctl list-sockets command, which will show you all of the sockets that are currently in memory and managed by systemd.
systemctl list-sockets | grep cockpit
What is a systemd socket?
A socket is a listening socket (e.g. a port) that is started and stopped by systemd.
The definition of the socket usually describes exactly how it should listen for traffic. A socket must also have a matching service, which describes the corresponding program that will be started, which will receive traffic via the socket.
You can list all sockets that your system knows about using systemctl list-sockets.
You can see what the socket configuration for Cockpit looks like, by using the command systemctl cat cockpit.socket.
Start Podman’s API so that Cockpit can interact with it
To see your containers in Cockpit, you’ll need to start the Podman API user service.
Cockpit uses the Podman API to see which containers you’re currently running.
You can quite easily run containers in Podman without this Podman API even running. But the API is useful when you want other applications to be able to view and manage your containers. So, to make sure Cockpit can see your containers, start the API.
Fire up the Podman user service. Do this using systemctl start with the --user option (note how I don’t use sudo for this, because I just want to run the user service, not the system-wide service):
systemctl start --user podman
To check it’s running properly, you can use systemctl status --user podman:
● podman.service - Podman API Service
     Loaded: loaded (/usr/lib/systemd/user/podman.service; static)
     Active: active (running) since Wed 2020-12-30 17:01:36 GMT; 3min 32s ago
TriggeredBy: ● podman.socket
       Docs: man:podman-system-service(1)
   Main PID: 2118593 (podman)
      Tasks: 32 (limit: 19003)
     Memory: 47.0M
        CPU: 1.631s
     CGroup: /user.slice/user-1000.slice/user@1000.service/podman.service
             ├─2118593 /usr/bin/podman --log-level=info system service
             └─2119312 /usr/bin/conmon --api-version 1 -c f3782a64753ebe5d80375dcb659faab0633471e4f332cf192>
Now we’re ready to log in and get going! Prepare to enter the cockpit.
Monitoring your Podman containers in Cockpit
To log in to Cockpit, go to this URL:
http://localhost:9090
and you’ll get a login page that looks like this:
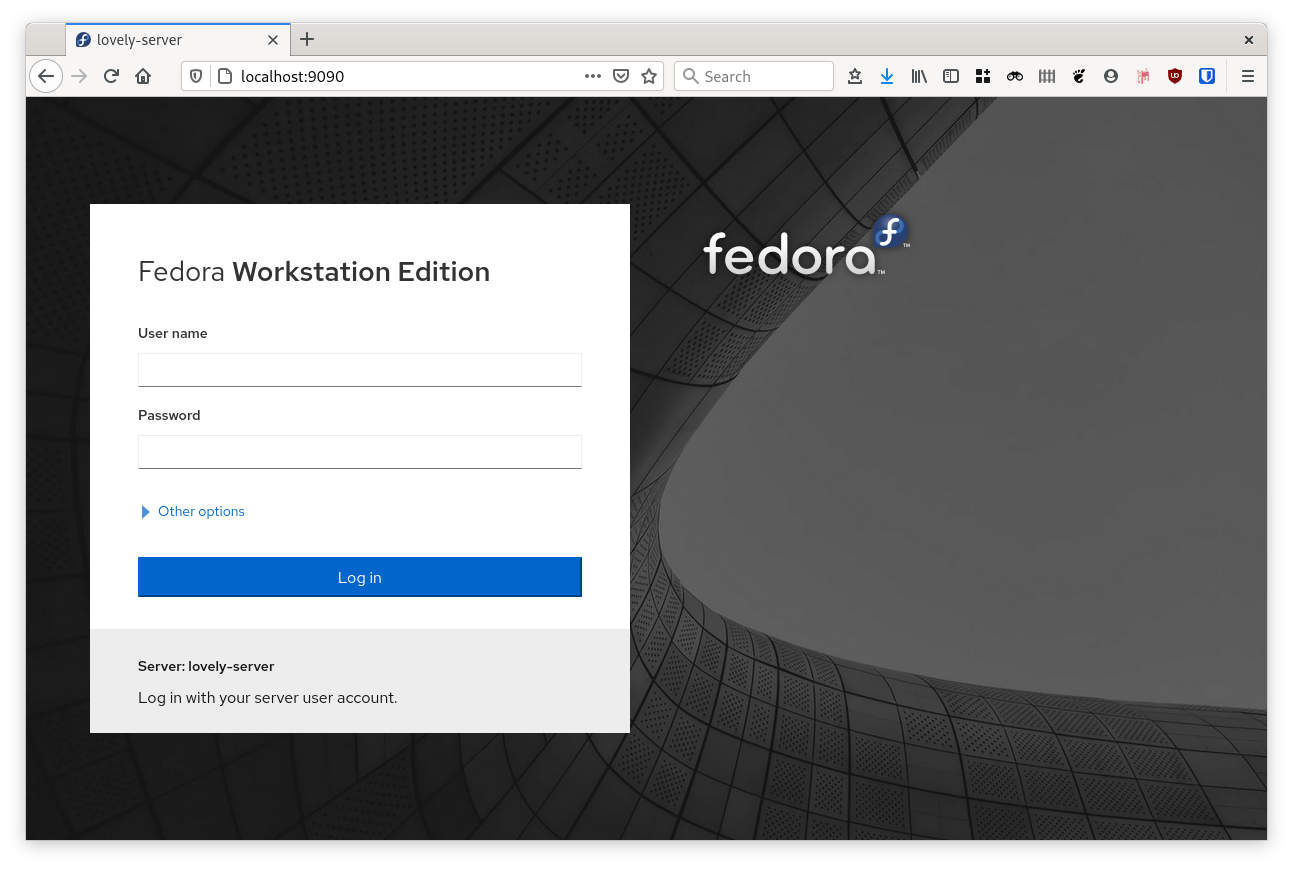
Preparing to enter the Cockpit
You’ll need to log in here with your normal Fedora credentials (username and password).
Check out your containers in the “Podman containers” view
The first port of call is the Podman containers view in Cockpit. You will see this view only if you’ve installed the cockpit-podman package as described earlier.
Click on Podman containers in the left menu, then you’ll see your Containers listed.
You can use the Podman containers view to see all your containers and images
For each container, you can click on the Arrow (>) to expand the view to see more information about the container.
For example, here’s all the info on my Nexus container I’m running. I can see the command which is running, the ports that are exposed, and the image:
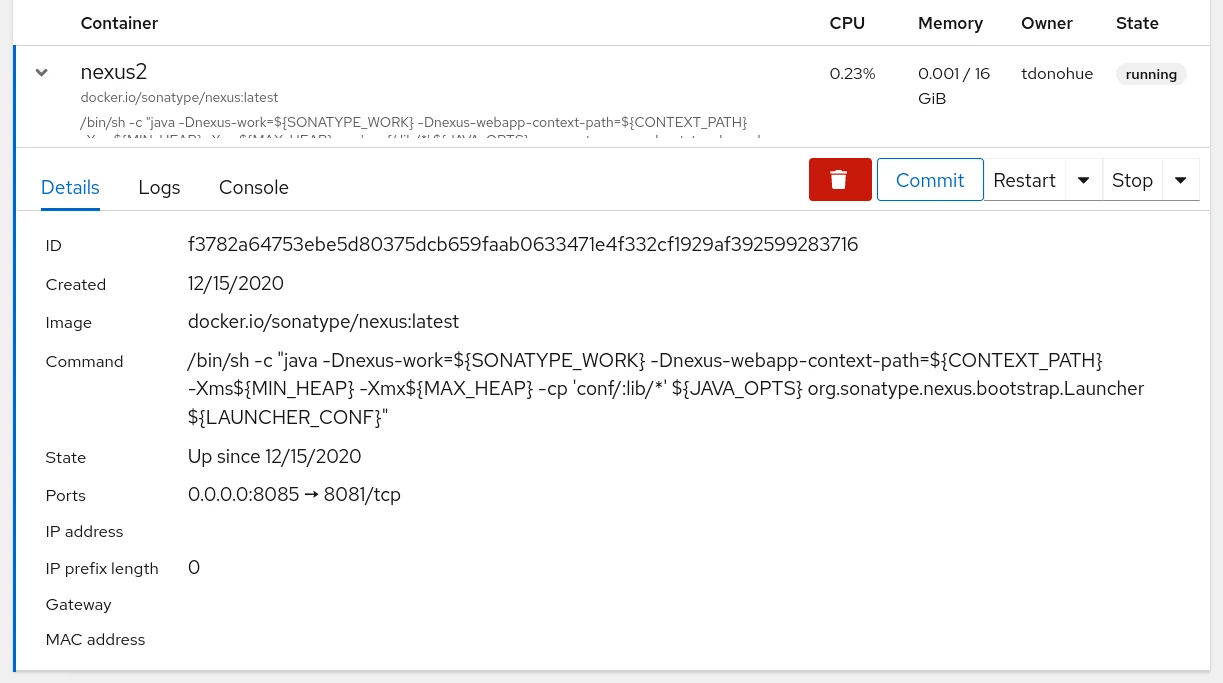
Viewing information about a container
It also gives you vital information like CPU and memory usage. You can use this to assess the health of your containers.
Moving across the tabs, you can also see the Logs, and the Console which we’ll look at next.
Get a console so you can run terminal commands in the container
Now this is a cool feature.
Need to do some debugging in a container, or run some commands?
In the Console tab, you will get a console in your web browser, which puts you right into the container. So, you can run some commands or do some debugging.
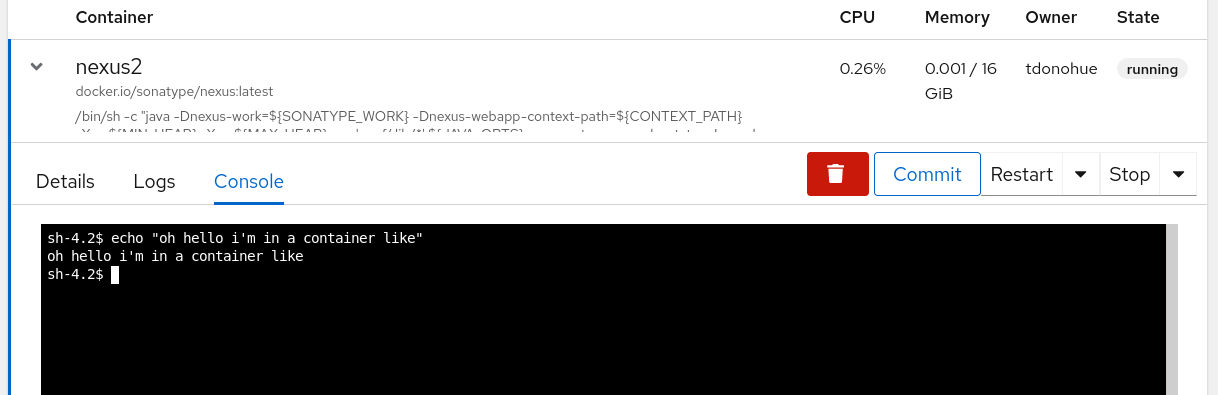
Use Cockpit’s console feature to run commands in a container from your web browser
No more podman exec ... commands needed! You can treat this console like a terminal. You’ll have access to the shell inside the container.
Searching for an image
This is also a really cool feature. The ability to search container registries from your web browser!
In the Images section, click Get New Image:
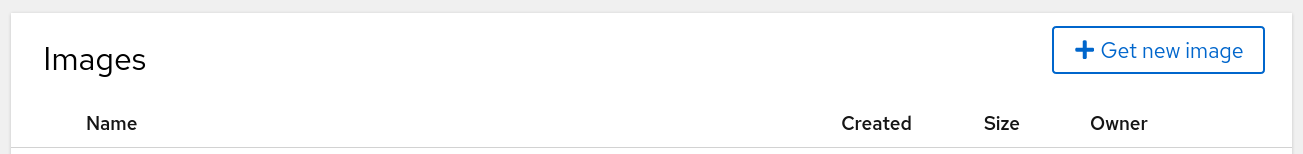
Click the Get New Image button
Then you’ll get a web form where you can search for images from public registries. You can even choose exactly which registry you want to search - awesome and very useful.
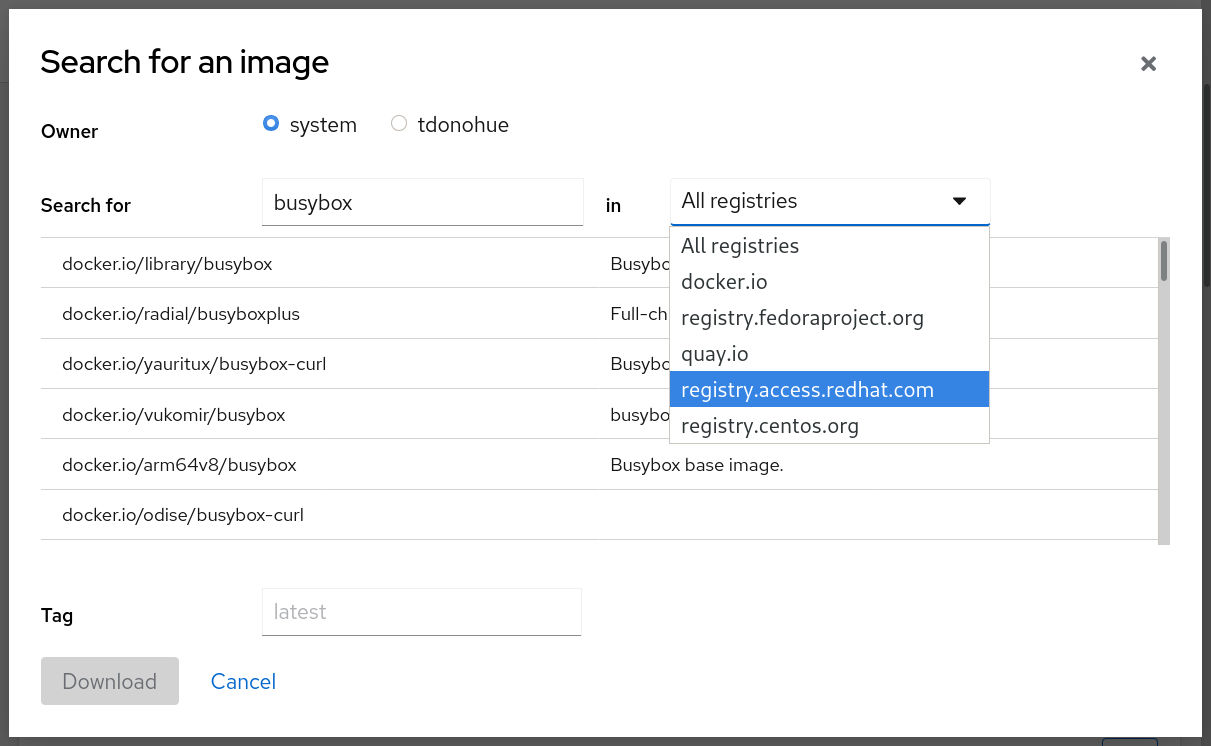
Search and pull images from registries right from Cockpit
Now you can just click the image you want, choose which tag, and download it.
Next steps
I hope you liked my quick guide to monitoring Podman containers in a web browser, with the fantastic Cockpit.
Are you just getting started with container development on Fedora? Why not look at my guide to setting up a Kubernetes development environment on Fedora?
Cheers!