How to generate Prometheus metrics from Spring Boot with Micrometer
You can publish a ton of useful metrics from your Spring Boot app with just a flick of a switch
The era of observability is most definitely upon us. These days, we don’t just want to know that our applications are running, we want to know how well they’re running.
Do you know how many requests your application is processing?
Do you know how long it takes to process each request?
Well, chances are, you probably don’t know. But it’s not too hard to find out! Because if your users are experiencing problems, you want to know about it. And you want to know about it before they do.
Metrics are one way to publish this sort of useful information about your apps. In this article we’ll learn more about metrics, and find out how to add Prometheus metrics to a Spring Boot app – using a great library called Micrometer.
How things used to be
OK here comes some boring backstory.
Many years ago, when I had more hair than now, I would finish developing something and hand my code over to an operations team for deployment into production (hey, this was pre-DevOps era!). But I was never really sure how it performed once it was deployed.
I would just sort of sit there, nervously, in the room with all the other developers, just wondering… and waiting…

Waiting….
Eventually, a bug report would come in, or someone from the production operations team would come over to my desk, and tell me that somebody had phoned the help desk to say that something was not quite right with the application.
Sound familiar? Whenever this happens, the first challenge is always trying to find out why.
Why is the app unresponsive? Why is it so slow?
Why have users been phoning the helpdesk all morning and – oh my God, how are there 1,000 Jira tickets about this already!?
So, to be a bit more proactive, and head off these issues early, we realised the need to monitor our applications.
Why monitoring? Why now?
But the problem is, historically, it’s been quite difficult to implement a standard way of monitoring many different types of applications.
Each language and framework has its own way of doing things. Unless you wanted to spend a lot of money on enterprise monitoring software (ker-CHING!) and install a bunch of monitoring agents everywhere, you probably had to roll your own solution.
But in the last few years, people have started to realise that, hey, could we just find a standard way of monitoring applications? And could we make it open source, so that everyone can use it?
I think this is for a few reasons.
Firstly, the number of applications that we are deploying is growing so much larger. Apps are getting smaller (I’m talking about those ubiquitous microservices), and there are simply far more applications now than there ever was.
Secondly, the business (read: your customer) now expects much more return from its investment in software. And part of this expectation is being able to see clear metrics about how well software is doing, or helping the company make, or lose, money.
And finally, the DevOps age is upon us. One of the key tenets of DevOps is measurement and learning. We want to measure the success of our applications, and learn from the results.
So, is there a tool that can help us record technical metrics, and make it easy to see trends?
Yes, that tool right now is Prometheus.
Introducing Prometheus
Prometheus is one way of solving this problem. It is a time-series database, which stores a sequence of data points, across time.
Prometheus… carrying the torch
Prometheus is used to store metrics and performance data from applications. And this allows you to perform time-series analysis of metrics.
A simple example of time-series analysis is looking at the number of requests your application has processed over time. You can see how many requests you processed in the last hour, or the last day, or the last week.
What is time-series analysis?
From the book Practical Time Series Analysis, by Aileen Nielsen:
Time series analysis is the endeavor of extracting meaningful summary and statistical information from points arranged in chronological order. It is done to diagnose past behavior as well as to predict future behavior.
So in other words, time-series analysis allows you to look at a set of data over time, and see trends, how you’re performing, and perhaps make some estimations about the future.
Prometheus runs separately from your application. So you can run a single instance of Prometheus, and it can fetch and store metrics from dozens of your apps.
And this is an important point: Prometheus uses a pull-based approach for getting metrics. It uses a set of instructions, to determine which applications to fetch metrics from, and how to do it.
This is good, because it means your application isn’t tightly coupled to Prometheus. Your application doesn’t need to know where Prometheus is located, or even be concerned if Prometheus has crashed or died! ⚰
Instead, Prometheus polls your application for its latest metrics data – this is known as scraping (it’s a horrible word, but it describes it well – think about it like web scraping, where you might regularly fetch data from a web page). Then, Prometheus adds the results into its time-series database.
Why use Prometheus?
Prometheus isn’t the only time-series database and metrics tool, but it is certainly the one which has got a lot of traction. It’s got built-in support for scraping applications, it’s got a built-in UI and query language for drawing charts, and it’s a CNCF Graduated Project (find it on the CNCF landscape).
And of course, it’s open source (yay!). When open source projects like Prometheus gain traction, there is an explosion in their use, which brings even more people to improve it, and adds even more features. And the whole ecosystem benefits.
So let’s assume your team has decided on Prometheus for capturing metrics. What do you need to add to your Spring Boot application to get your metrics into Prometheus?
Publishing metrics in Spring Boot 2.x: with Micrometer
The good news is you can add Prometheus support to a Spring Boot application very easily. In fact there a couple of ways.
If you check the Prometheus docs, it will recommend that you add the Prometheus JMX Exporter or Prometheus Java client to your application.
This is fine I guess, but these tools are designed specifically for Prometheus.
What if you want to connect another time-series database, or monitoring tool? Would you have to attach their agent as well?
There is a better alternative.
Micrometer can help you take measurements from your application, and publish those metrics ready to be scraped by many different applications, including Prometheus.

Micrometer helps you measure
Micrometer is a set of libraries for Java that allow you to capture metrics and expose them to several different tools – including Prometheus.
Micrometer acts as a facade – an intermediate layer – between your application and some of the more popular monitoring tools. This makes it easier to publish metrics to Prometheus and other tools like Elastic, Datadog or Dynatrace.
This is great for us, because once we have added Micrometer to our application, it will happily sit there collecting and exposing metrics. We can choose to enable the publishing of metrics for specific clients, like Prometheus, with a simple switch.
From Spring Boot 2, support for Micrometer is available right out of the box.
So let’s have a look at the basics of how to add Prometheus support to a Spring Boot application.
Adding Prometheus to Spring Boot
To instrument our application to collect metrics to send to Prometheus, we need to add a few dependencies first.
The first dependency we need to add is the Spring Boot Actuator. This is the part of Spring Boot which exposes some APIs, for health-checking and monitoring of your apps, as per the documentation:
“Actuator endpoints let you monitor and interact with your application. Spring Boot includes a number of built-in endpoints, and lets you add your own.”
To add the Actuator feature, add this dependency:
<dependency>
  <groupId>org.springframework.boot</groupId>
  <artifactId>spring-boot-starter-actuator</artifactId>
</dependency>
This will configure the Actuator, which already includes Micrometer.
We can see that the Actuator dependency already includes Micrometer, by checking it with Maven’s dependency:tree goal:
$ mvn dependency:tree -Dincludes=io.micrometer:micrometer-core
...
[INFO] --- maven-dependency-plugin:3.1.2:tree (default-cli) @ spring-boot-with-metrics ---
[INFO] com.tutorialworks.demos:spring-boot-with-metrics:jar:0.0.1-SNAPSHOT
[INFO] \- org.springframework.boot:spring-boot-starter-actuator:jar:2.4.1:compile
[INFO]    \- io.micrometer:micrometer-core:jar:1.6.2:compile
Next, you will need to add the Micrometer registry dependency which specifically enables Prometheus support.
This allows the metrics collected by Micrometer to exposed in a format that will be understood by Prometheus:
<dependency>
  <groupId>io.micrometer</groupId>
  <artifactId>micrometer-registry-prometheus</artifactId>
  <scope>runtime</scope>
</dependency>
Next, we need to tell Spring Boot’s Actuator which endpoints it should expose. An endpoint is a grouping of information that the actuator will expose. In our case, we want to expose Prometheus. So we add this line to application.properties:
management.endpoints.web.exposure.include=health,info,prometheus
Now we’re good to go! With these dependencies added to your Spring Boot 2.x application, many metrics will be exposed automatically on the actuator endpoint, which is /actuator/prometheus.
You can stop here if you like, and just expose some basic metrics: start the application as normal, and send a request to http://localhost:8080/actuator/prometheus
But I think it’s more interesting to be able to capture some custom metrics.
In my example, I’m writing an app with a REST API, and I want to see how long the request takes to process.
I want to time how long one of my methods takes to execute, and report that as a metric. So now let’s move on to adding a custom metric.
Creating a custom metric
A lot of the time you’ll be satisfied by the basic metrics you get out of the box with Micrometer. But you might want to add your own custom metrics.
Micrometer can publish different types of metrics, called primitives. These include gauge, histogram and timer.
When you’re adding your own custom metric, you really need to think first about what type of data you’re going to collect.
Is it a simple number, which counts something? Or do you want to calculate a rolling average of some value?
Different use cases demand a different metric type. Here are the main types of metrics in Micrometer, and how they are used. Take a moment to choose the metric type which is right for you.
| Metric type | Use it for… | Examples |
|---|---|---|
| Gauge | Measuring resource usage, capacity, etc. Values that can rise and fall, and that have fixed upper bounds | Size of a collection, number of running threads, number of messages on a queue, memory usage |
| Counter | Measuring a number of events or actions - a value that only increases, and never decreases. | Total number of orders processed, total tasks completed, etc. |
| Timer | Measuring short-duration events and their frequency | Method execution time, request duration, time taken to boil an egg. |
As I want to record how long a method takes to execute, I will be using the Micrometer Timer metric type. A timer records the duration of an activity, and its frequency. So I will be able to see how long my method takes to execute, and how often it’s called.
To add a custom timer, we need to add a new dependency – the AOP dependency for Spring Boot.
<dependency>
  <groupId>org.springframework.boot</groupId>
  <artifactId>spring-boot-starter-aop</artifactId>
</dependency>
We need this dependency because of the way that Micrometer times methods. It depends on AspectJ, which is included in Spring’s AOP feature.
We also need to register the TimedAspect bean in our Spring context. This will allow Micrometer to add a timer to custom methods. Register the bean to your @SpringBootApplication or @Configuration class:
// io.micrometer.core.aop.TimedAspect
// org.springframework.context.annotation.Bean
// io.micrometer.core.instrument.MeterRegistry

@Bean
public TimedAspect timedAspect(MeterRegistry registry) {
    return new TimedAspect(registry);
}
Then, find the method that you want to time, and add the @Timed annotation to it. Use the value attribute to give the metric a name.
// io.micrometer.core.annotation.Timed

@Timed(value = "greeting.time", description = "Time taken to return greeting")
public Greeting getGreeting() {
    return new Greeting());
}
Micrometer will now calculate the execution time of the method.
Now we’re ready to start up the application and check out our metrics!
Inspecting the metrics
Let’s take a look at the metrics now being exposed by Spring Boot’s Actuator, and Micrometer.
Start your application, and send an HTTP get request to http://localhost:8080/actuator/prometheus. You will see all of the metrics being exposed.
If you don’t see your custom metric, make sure that you have triggered the code to be executed. The metric won’t appear until the timer has recorded at least once.
I make a request to my web service, which triggers the method I annotated with @Timer, and now I can see the greeting_time_seconds_* metrics being exposed, which show the number of times my method was executed, the total time taken, and the maximum:
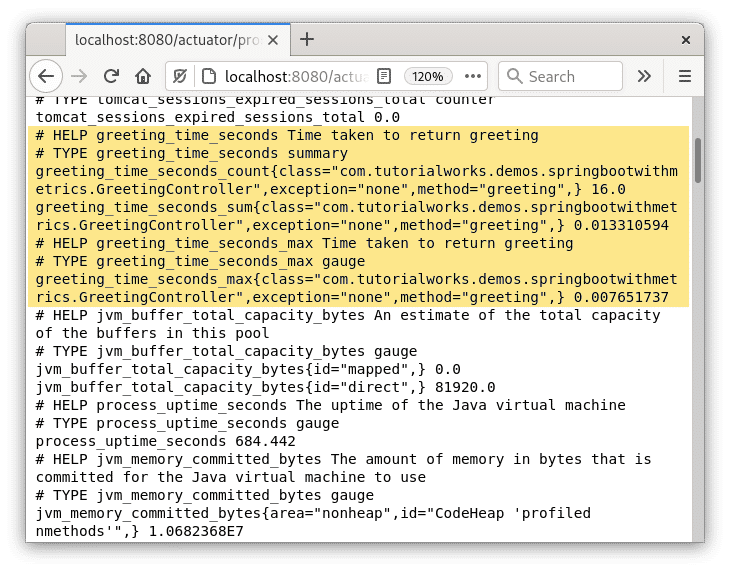
The Actuator Prometheus endpoint now displays our metrics
Displaying these metrics is all well and good, but we want to get them into Prometheus, which is what we’ll look at next.
Getting metrics into Prometheus
To observe these metrics in Prometheus, we need a Prometheus instance first. :)
You can use your own existing Prometheus instance. But, if you don’t have one, or you just want to spin up a test instance, then I recommend starting it in a container. (One of the great reasons to use software containers is to run third-party software like Prometheus easily, without having to download and install it.)
We need to configure Prometheus with scraping rules, to tell it exactly how it should scrape metrics from our Spring Boot app. We give these scraping rules in a settings YAML file.
This is my settings file, prometheus.yml:
# Sample Prometheus config
# This assumes that your Prometheus instance can access this application on localhost:8080

global:
  scrape_interval:     15s # Set the scrape interval to every 15 seconds. Default is every 1 minute.
  evaluation_interval: 15s # Evaluate rules every 15 seconds. The default is every 1 minute.
  # scrape_timeout is set to the global default (10s).

scrape_configs:
  - job_name: 'spring boot scrape'
    metrics_path: '/actuator/prometheus'
    scrape_interval: 5s
    static_configs:
      - targets: ['localhost:8080']
The settings file configures Prometheus to scrape metrics from localhost:8080/actuator/prometheus every 5 seconds. This frequency can be changed, depending on how granular you want to get.
Next, we need to start Prometheus and feed this config to it.
I use Podman to start a container, pulling in the official Prometheus image from Docker Hub:
podman run --net=host \
    -v /path/to/your/prometheus.yml:/etc/prometheus/prometheus.yml:Z \
    prom/prometheus
I use Podman here, but you could use Docker.
Note that I am using --net=host. This connects the Prometheus container to the host network, which means that the container will be able to access my Spring Boot app on localhost.
And, since I’m running this demo on Linux, with SELinux enabled, I add the :Z label to the volume, which gets podman to do the necessary relabelling to allow the prometheus.yml file to be used by the container. If you’re not running SELinux, you can omit this :Z part.
Now we have a demo instance of Prometheus! See, it was rather simple.
Finally, we’ll take a look at Prometheus, check that our metrics are being scraped, and view a sample chart.
Observing the metrics in Prometheus
First, let’s check that Prometheus is scraping from our application properly. To do this, we first open up Prometheus by going to http://localhost:9090 and going to Status > Targets.
The Targets view tells us which applications or endpoints Prometheus is currently scraping from, and also shows the general health of our scraping:
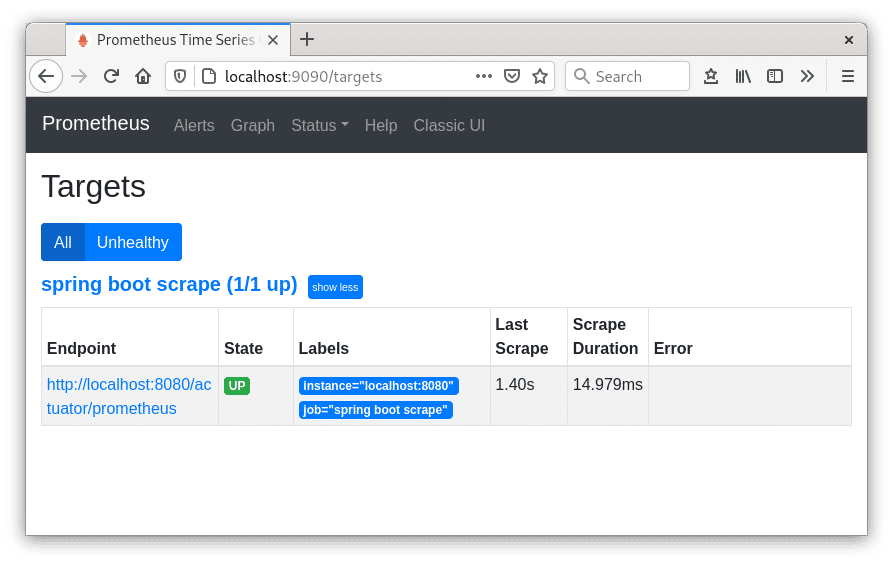
Prometheus showing off its healthy Targets
Now we’re satisfied that Prometheus is scraping from our application, we can try searching for a metric, and drawing a chart.
Go to the Graph tab. Search for the metric process_cpu_usage and Prometheus will create a chart from it:
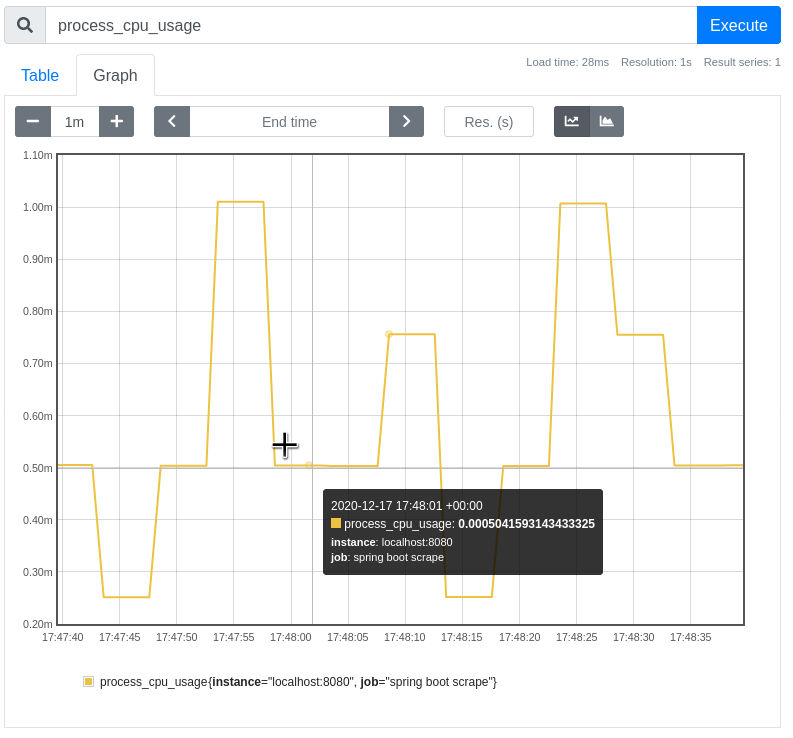
Micrometer captured the CPU usage of the JVM process
From this chart, we can observe the performance of the application. This is one of the out-of-the-box metrics that Micrometer exposes.
But what about our custom metric? Can we find out how long our method is taking to execute?
Just search for the metric by name. In this example, I chose the name greeting_time_seconds_max:
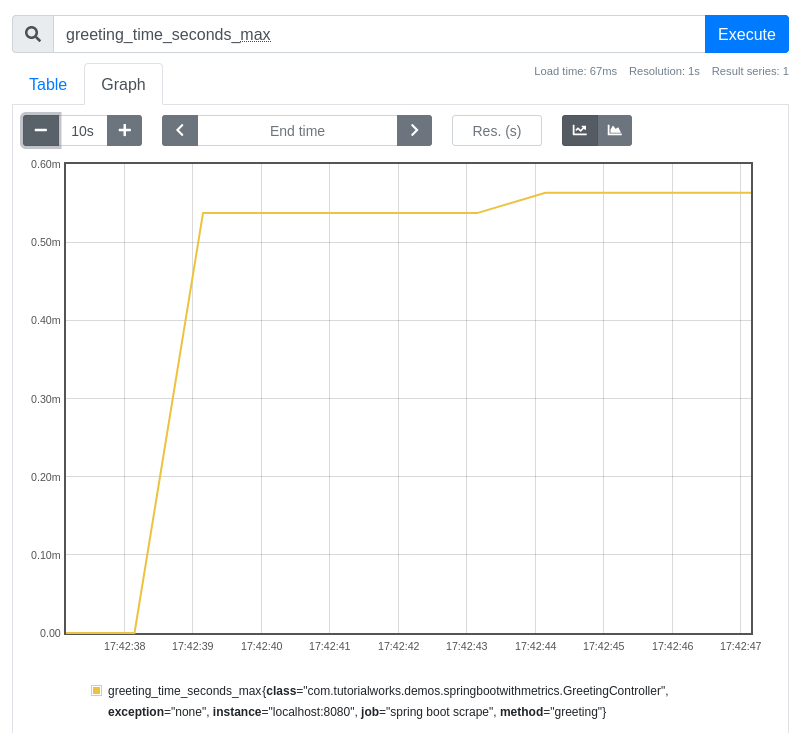
Our custom metric is available for charting in Prometheus
Ace! The custom metric is there. Now I really know how long it takes for this specific method to execute. This will be valuable information, especially if I start getting calls about how slow the app is.
Conclusion
We’re all developing more and more applications these days. And that means much more lovely complexity to manage and monitor.
It’s so crucial that we add monitoring and metrics to our applications. These metrics allow us to see the health of our applications.
And we need to do this seamlessly – without having to add a lot of custom code or messy integration code.
You can collect metrics from your Spring Boot application quite easily using Micrometer, without any custom code required at all. These metrics can be quite easily collected into Prometheus for reporting.
Want to take the next step after this tutorial? Try adding your Prometheus instance to an open source dashboard tool like Grafana.
And in the meantime, if you want to see a completed example, then you can get the source code used in this article on GitHub:
If this article has helped you out, please consider giving it a share with your network!
And have fun with your metrics. :)